Figures & Graphs
From my research project; Auditing AI-Generated Hiring Assessments.
| M.A. Ethics of Artificial Intelligence | University of Guelph | 2025 |
This applied research project audited ChatGPT's reliability and fairness as a candidate interview evaluator. By comparing ChatGPT-generated ratings to those of trained humans across 60 video interviews, the study revealed systematic bias patterns: ChatGPT consistently scored candidates higher (+0.88 points average), particularly underrating Black candidates and overrating middle-aged candidates; patterns absent in human evaluations.
These findings demonstrate that AI evaluation tools, when used in sensitive decision-making like hiring, require rigorous fairness audits and oversight before deployment, with clear implications for organizations considering using AI to influence their hiring decisions.
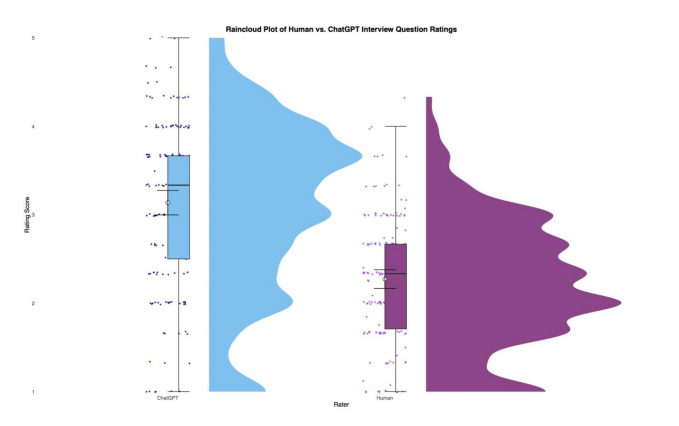
Figure 2: Rating Distribution Comparison: AI vs. Human Ratings
ChatGPT ratings (left, blue) consistently skewed higher than human ratings (right, purple), with greater variability in score distribution. While both raters followed the same 5-point BARS scale, AI showed systematic inflation with mean scores of 3.14 vs. 2.27 for humans; a difference of 0.88 points representing a large effect (d = -1.08).
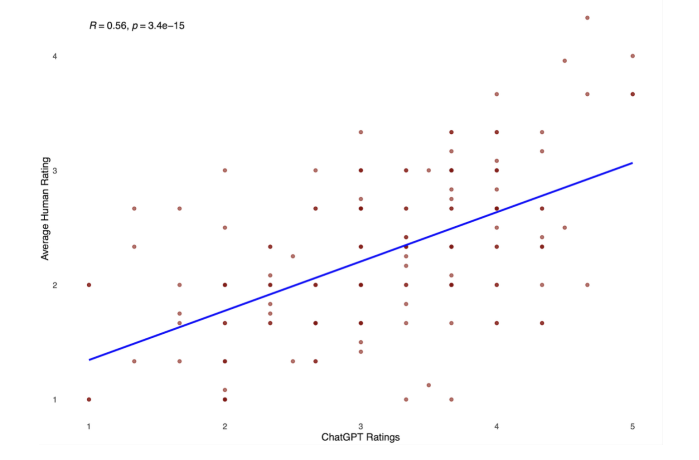
Figure 3: Overall Correlation between ChatGPT & Human Ratings
Scatterplot illustrating the relationship between ChatGPT-generated interview ratings and average human-assigned ratings. Each point represents a single participant, and the blue line depicts the least-squares regression line. The correlation coefficient (r) and corresponding p-value are displayed in the upper left corner. Human ratings reflect the average of four trained raters, who demonstrated high inter-rater reliability and consistent evaluation standards.
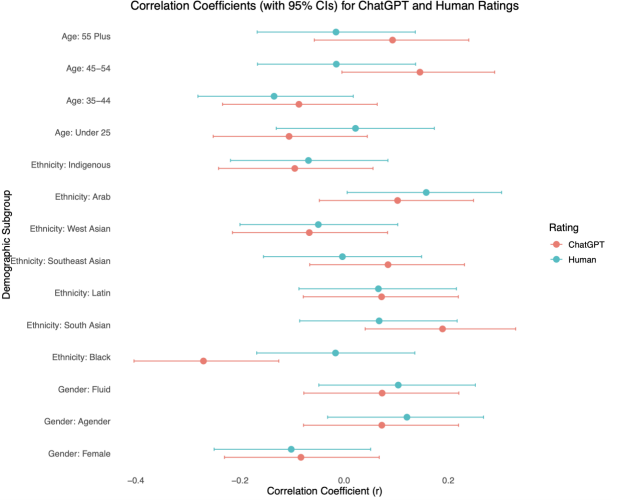
Figure 4: Difference in Correlations (r) Between ChatGPT and Human Ratings, By Demographic Subgroup
Correlation coefficients between demographic subgroup membership and interview ratings, separately for ChatGPT-generated and human-assigned scores. Each point represents the Pearson correlation (r) for a given demographic subgroup, with horizontal bars indicating 95% confidence intervals. Subgroups are ordered vertically by category, and rating sources are color-coded and shown side by side for direct comparison.